facebook-script
Man on laptop smiling with graphs around him like a donut chart showing different colours, a KPI line chart in the background, and a stacked bar chart with labels like Met, Unmet, Etended, etc
Ausmed Intelligence™

From data to actionable insights, in seconds.

Make audits, executive presentations and manager updates fast, easy and effective by instantly transforming complex data into actionable insights.

Effortlessly transform complex data into valuable reports when you need it most.

A donut chart showing Learning Completion Rate

Construct insightful documents for the board to update them on key initiatives.

Audit-ready at a moments notice. Ensure your entire team is prepared for compliance checks with up-to-date, easily accessible data.

A series of stacked bar charts with the heading '% of requirements met by item' and item names including BLS, Duty of Care, etc
Image of lady standing next to a graph that shows learning compliance at 91%

Mitigate key person risk. Enable the entire team to access and interpret crucial data with auto-generated monthly reports across your teams and locations.
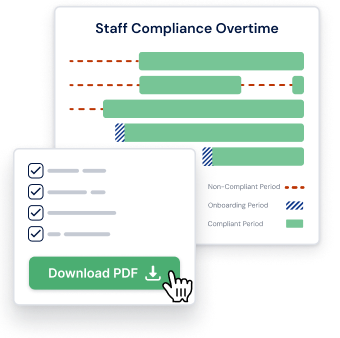
Graphs showing Staff Compliance Overtime and a Download PDF button

Your all-in-one BI and data analysis tool.

Quickly generate clear, professional updates and reports tailored to your audience—whether it’s for audits, executive teams, or staff meetings.

Unlock smarter, faster decision-making with Ausmed Intelligence™ and our Workforce Capability Platform. Ausmed Perform™ and our Workforce Capability Platform.